
Demographics

Highlights
In 2023, 835,000 people lived in New Brunswick, an increase of 3.1% from 2022 to 2023. New Brunswick represents 2.1% of Canada's total population.
Average age of the non-Indigenous population in the province is 45, versus 37 in the Indigenous population (Census 2021).
- New Brunswick’s population increase in 2023 (+25,100) was due to record immigration (+11,000) and a near-high in net interprovincial migration (+6,900).
- The proportion of seniors aged 65 years and older is projected to increase from 23.0% in 2023 to 27.8% in 2033.
- In 2023, individuals aged 55 years and over accounted for 44.1% of the working-age population. By 2033, that proportion could reach 46.4%.
- The proportion of youth (aged 15-29 years) is projected to increase from 10.9% in 2023 to 16.1% in 2033.
The Indigenous population comprises 4.4% of the total provincial population (2021 Census) and continues to be under-represented in the labour market, accounting for 4.0% of the provincial labour force. The unemployment rate is notably higher amongst Indigenous people (16.4%) compared to the non-Indigenous working-age population (10.1%).
Recent immigrants (those arriving between 2016 and 2021) accounted for over a third (36.4%) of New Brunswick's immigrant population in 2021. The pace of new arrivals has increased significantly in recent years, particularly as the province has looked to immigration to fill existing labour market gaps.
Over two-thirds (69.5%) of New Brunswick residents identified English as their first official language (Census 2021), while 30.3% identified the province's other official language, French. Only 0.2% identified a first language that was neither English nor French.
According to 2022 results from the Canadian Survey on Disability, 35.3% of those aged 15 years and older in New Brunswick were persons with disabilities, representing an 8.6% increase from 2017. Disability rates tend to rise with age, so the results are consistent with the fact that the province’s population base is growing older, on average.
Labour Market Conditions
In 2023...
Employment grew at a healthy pace (3.5%)
Unemployment fell sharply (-6.6%)
Participation rate was essentially unchanged (-0.1 p.p.)
Employment rate increased slightly (56.2% to 56.6%)
New Brunswick's Unemployment Rate

Show data table: Unemployment Rate
| Unemployment Rate (%) | |
|---|---|
| 2000 | 10.0 |
| 2001 | 11.1 |
| 2002 | 10.1 |
| 2003 | 10.2 |
| 2004 | 9.8 |
| 2005 | 9.7 |
| 2006 | 9.2 |
| 2007 | 7.7 |
| 2008 | 8.7 |
| 2009 | 9.0 |
| 2010 | 9.4 |
| 2011 | 9.6 |
| 2012 | 10.4 |
| 2013 | 10.4 |
| 2014 | 10.1 |
| 2015 | 10.0 |
| 2016 | 9.7 |
| 2017 | 8.3 |
| 2018 | 8.1 |
| 2019 | 8.2 |
| 2020 | 10.3 |
| 2021 | 9.2 |
| 2022 | 7.2 |
| 2023 | 6.6 |
- New Brunswick’s labour market continued to improve in 2023, thanks to record growth in the working age population and strong labour demand. The province’s labour force expanded by 11,100 (+2.8%), while there were an additional 13,000 people working (+3.5%).
- The number of persons unemployed in New Brunswick fell by 1,900 (-6.6%) and the province’s unemployment rate now stands at 6.6%, the lowest on record. The main reason that labour force growth has lagged other indicators during the past few years is a gradual reduction in labour force participation. At 60.5%, New Brunswick’s labour force participation rate is the lowest it’s been since 1997. Much of this is due to an increasing share of seniors, who are less likely than the overall population to seek work.
Economic Conditions
New Brunswick's Economic Drivers in 2023
Population growth
Consumer spending
Residential investment
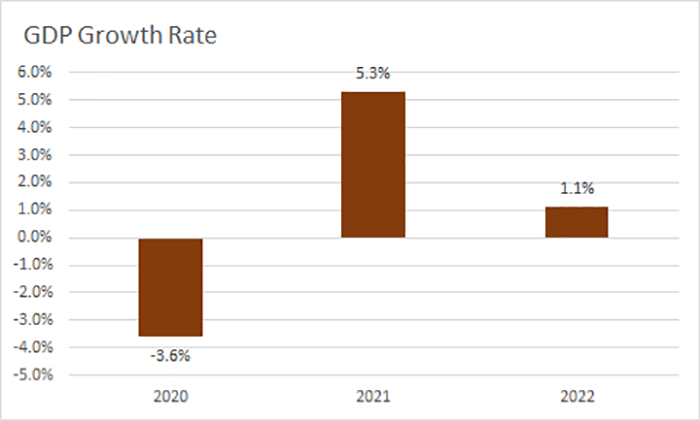
Show data table: GDP Growth Rate
| GDP growth rate (%) | |
|---|---|
| 2020 | -3.6% |
| 2021 | 5.3% |
| 2022 | 1.1% |
- While Atlantic Immigration Program targets (including international students) have been scaled-back somewhat, going forward, population growth is not expected to return to negative territory. Growth in 2023 (+3.1%) was anchored by net positive international migration (+11,000), while people continue to arrive from other provinces at a historically elevated level (+6,900).
- A tight labour market has led to significant upward pressure on wages, with New Brunswick among the nation’s growth leaders. In 2023, growth in the province’s average hourly wage reached 6.8%, surpassing the national average of 6.5%. This has translated to a surge in consumer spending, evidenced by huge growth in retail trade sales (12.8% in 2021, 7.8% in 2022 and 4.5% in 2023).
- All levels of government have committed to raising housing development as a near-term priority, particularly in affordable housing. The federal government intends to use its $4B Housing Accelerator Fund to grow the nation’s housing supply, with an aim to create 100,000 new homes in the country’s urban centres by 2024-25.
Risks to the New Brunswick Economy in 2024
- Prices for many goods and services remain elevated with respect to incomes. Significant increases over the past few years on necessities like shelter and food will probably limit household discretionary spending, going forward.
- While the bank of Canada has signalled that it will likely begin to roll back its target rate, consumers are currently renewing their mortgages at higher rates than they did five years ago (the typical length of a mortgage term), increasing the risk of default.
- A slowing U.S. economy could lead to less demand for manufactured goods, though a weaker Canadian dollar could mitigate some of these impacts. The wood products industry may be particularly vulnerable, should demand from the U.S. home construction industry decline, as a lot of shipments are destined for south of the border.
Provincial Issues
Labour shortages and skills mismatches continue to exist, particularly in key industries like healthcare, education, construction, trucking, and manufacturing. This has created a range of challenges for employers, including higher costs and reduced productivity.
With seniors accounting for a growing share of the population (23% in 2023), there are fewer people replacing retiring workers, leading to downward pressure on the labour force and hiring challenges for employers. At the same time, a growing number of seniors are exerting upward pressure on health care costs.
The province’s population has grown rapidly over the past few years and construction of new housing units has failed to keep up. The result has been a steep escalation in housing values (nearly 20% growth since 2020), pricing a lot of would-be buyers out of the market and increasing rental rates.
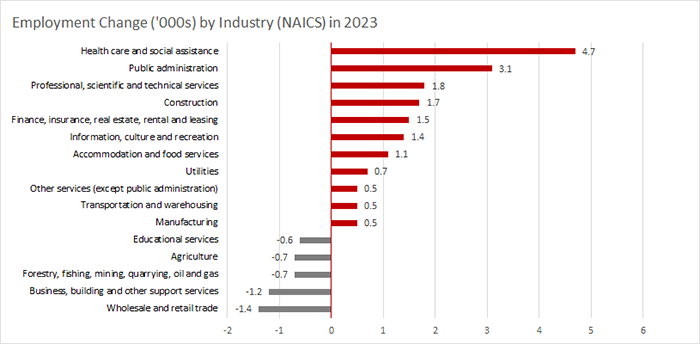
Industry Trends
Show data table
| Industry (NAICS) | Employment Change ('000s) |
|---|---|
| Health care and social assistance | 4.7 |
| Public administration | 3.1 |
| Professional, scientific and technical services | 1.8 |
| Construction | 1.7 |
| Finance, insurance, real estate, rental and leasing | 1.5 |
| Information, culture and recreation | 1.4 |
| Accommodation and food services | 1.1 |
| Utilities | 0.7 |
| Other services (except public administration) | 0.5 |
| Manufacturing | 0.5 |
| Transportation and warehousing | 0.5 |
| Educational services | -0.6 |
| Agriculture | -0.7 |
| Forestry, fishing, mining, quarrying, oil and gas | -0.7 |
| Business, building and other support services | -1.2 |
| Wholesale and retail trade | -1.4 |
- Nine out of 10 jobs added in 2023 were in the services-producing sector, which grew by 11,400 (+3.8%), outpacing the goods-producing sector (+1,500; +2.0%).
- Health care and social assistance led all industries, adding 4,700 jobs, thanks largely to strong nurse recruitment efforts. Another 3,100 jobs were added in public administration, marking a fourth straight year of net positive hiring.
- The two most tourism-dependent industries saw their best performance since the pandemic, adding 2,500 jobs. Information, culture, and recreation expanded by 13.7%, while accommodation and food services rose by 5.5%.
Regional Economic Conditions
- All five of the province’s economic regions (ER) registered job gains in 2023. The greatest increase, in percentage terms, was observed in the Moncton-Richibucto ER (+5.6%), which added 6,500 jobs thanks to an impressive gain in the number of full-time positions.
- Unemployment rates were down in every region but one (Moncton-Richibucto), thanks to employment gains exceeding labour force growth. In 2023, Fredericton-Oromocto boasted the lowest unemployment rate (5.2%) of all ERs.
- If there were any negatives on the mostly positive labour market performance, it would be the declines in the rate of labour market participation for three of the five ERs. The greatest reduction was observed in the Saint John-St. Stephen ER (-1.7 percentage points), followed by Fredericton-Oromocto (-1.2 percentage points), and Edmundston-Woodstock (-0.4 percentage points).
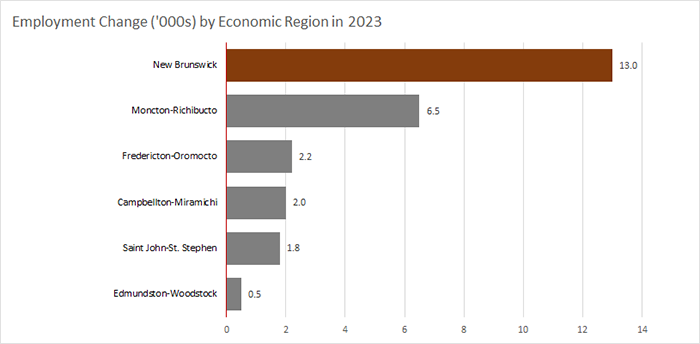
Show data table
| Employment Change by Economic Region in 2023 ('000s) | |
|---|---|
| New Brunswick | 13.0 |
| Moncton-Richibucto | 6.5 |
| Fredericton-Oromocto | 2.2 |
| Campbellton-Miramichi | 2.0 |
| Saint John-St.Stephen | 1.8 |
| Edmundston-Woodstock | 0.5 |
Download the PDF version (552 KB) of this content.
- Date modified: